Getting shapes into numbers
A mathematical framework enables accurate characterization of shapes
In nature, many things have evolved that differ in size, color and, above all, in shape. While the color or size of an object can be easily described, the description of a shape is more complicated. In a study now published in Nature Communications, Jacqueline Nowak of the Max Planck Institute of Molecular Plant Physiology (MPI-MP) and her colleagues have outlined a new and improved way to describe shapes based on a network representation that can also be used to reassemble and compare shapes.
We are surrounded by objects that differ in many characteristics, but the one that guides our attention is that of shape. While some shapes, like circles and squares, are easy to describe, others, like pieces of jigsaw puzzle, are more complex. With the variety of shapes that we encounter, it is important to develop descriptors of shapes that capture their particularities and complexity. Powerful descriptors of shape find many applications, from automated categorization of objects in production chains, architecture and archeology to medical imaging for surgical planning and understanding of human perception. In addition, shape description has a central standing in biology where it provides the foundation to identify pathological tissue deformations and to understand how the shape of cells and organs develop; also termed morphogenesis.
, nodes are evenly spaced and connected by edges when they do not touch or intersect the contour.")
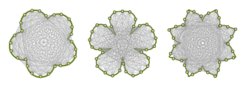
Jacqueline Nowak designed a novel approach that relies on a network-based shape representation, named visibility graph, along with a tool for analyzing shapes, termed GraVis. The visibility graph represents the shape of an object that is defined by its surrounding contour and the mathematical structure behind GraVis is specified by a set of nodes equidistantly placed around the contour. The nodes are then connected with each other by edges, that do not cross or align with the shape boundary. As a result, testing the connection between all pairs of nodes specifies the visibility graph for the analyzed shape.
In this study, Jacqueline Nowak used the visibility graphs and the GraVis tool to compare different shapes. To test the power of the new approach, visibility graphs of simple triangular, rectangular and circular shapes, but also complex shapes of sand grains, fish shapes and leaf shapes were compared with each other. By using different machine learning approaches, they demonstrated that the approach can be used to distinguish shapes according to their complexity. Furthermore, visibility graphs enable to distinguish the complexity of shapes as it was shown for epidermal pavement cells in plants, which have a similar shape to pieces of jigsaw puzzle. For these cells, distinct shape parameters like lobe length, neck width or cell area can be accurately quantified with GraVis. “The quantification of the lobe number of epidermal cells with GraVis outperforms existing tools, showing that it is a powerful tool to address particular questions relevant to shape analysis.” says Prof. Zoran Nikoloski, GraVis project leader, head of the research group “Systems biology and Mathematical Modelling” at the MPI-MP and Professor of Bioinformatics at University of Potsdam.
In future, the scientists want to apply visibility graphs of epidermal cells and entire leaves to gain biological insights of key cellular processes that impact shape. In addition, shape features of different plant cells quantified by GraVis can facilitate genetic screens to determine the genetic basis of morphogenesis. Finally, the application of GraVis will help to gain deeper understanding of the interrelation between cells and organ shapes in nature.
BP/UG